the measurements below remain a historical kernel sweep, but the statement that Ember's current gate activates near 32 MFLOPs is stale. the present Q8×Q8 decode path uses a 1,048,576-MAC gate (about 2.1 MFLOPs).
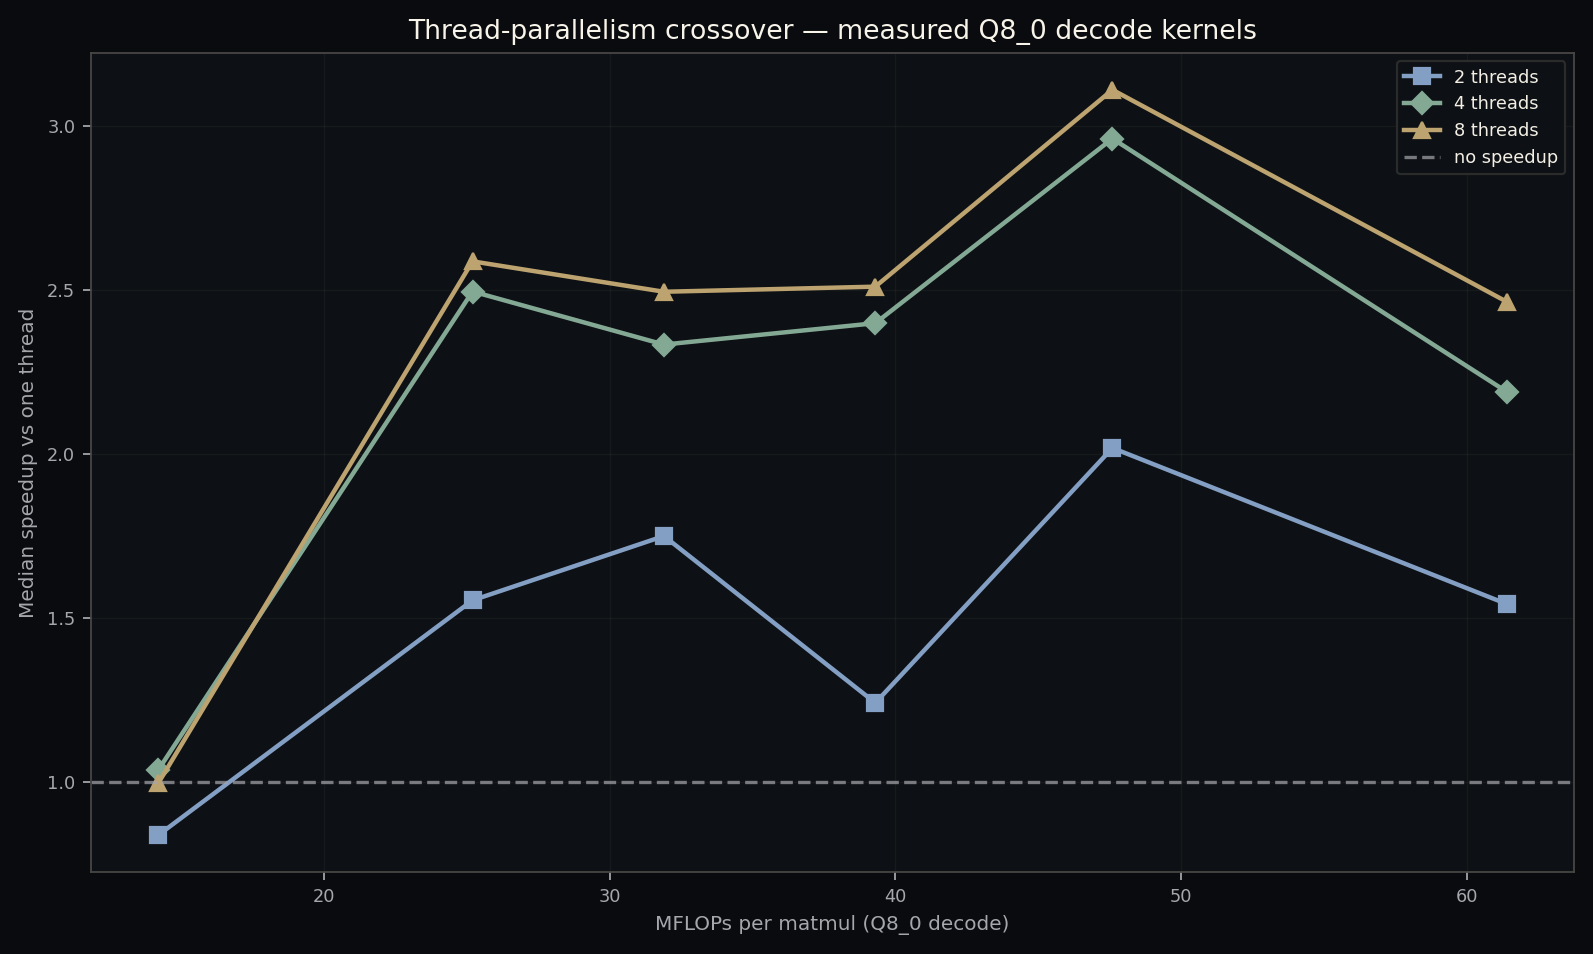
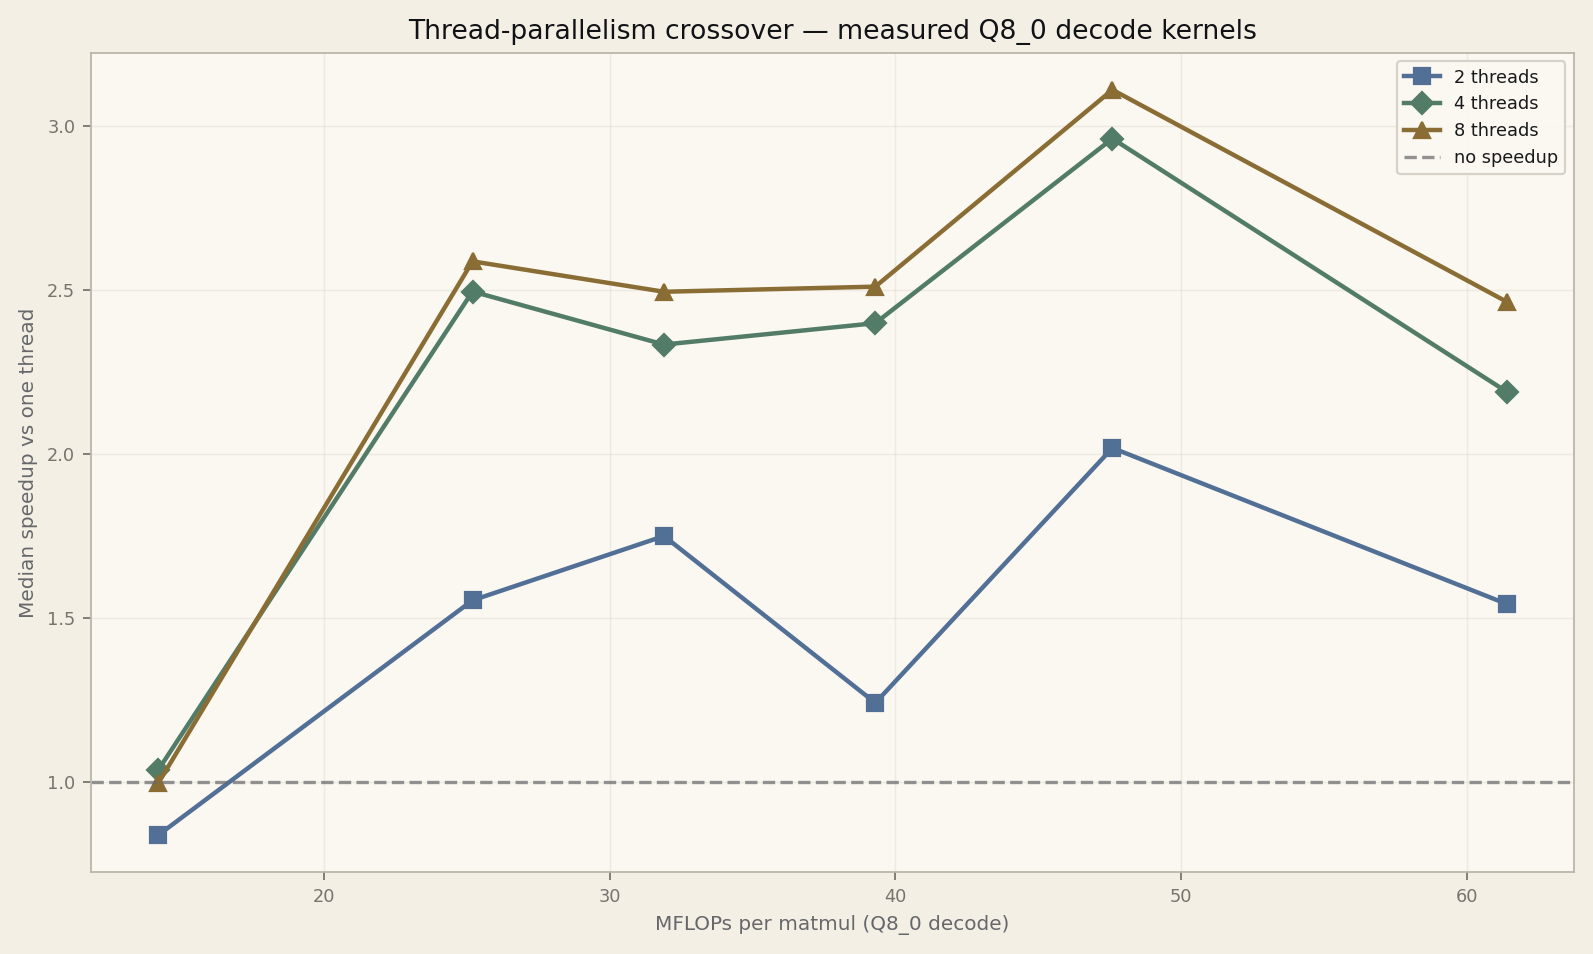
the measured “crossover” is also thread-count-specific: two and eight threads first exceed 1× between the 14.2 and 25.2 MFLOP test points, while four threads are only marginally above 1× at the first point. these are observed medians, not a universal hardware threshold.
The setup, estimates, and next steps below belong to the date of this note. The recorded results are retained; this editorial update is not a rerun or a claim that the historical implementation is still current.
The isolated Q8_0 kernel benefited from extra threads only at particular workload sizes. On this CPU, two and eight threads first exceeded 1× between the 14.2 and 25.2 MFLOP samples. These historical kernel medians are not a universal threshold or an end-to-end decode speedup.
but does single-token decode actually benefit from more threads?
the answer depends on model size, kernel implementation, and the CPU. this note finds the crossover point where thread parallelism starts helping, and shows why a fixed global thread count is the wrong abstraction.
during decode, a transformer produces one token at a time. each token passes through every layer: attention projections, MLP projections, RMS norms, rotary embeddings.
most of that work is matrix multiplication: small matmuls, one after another, each processing a single row of activations against a quantized weight matrix.
those matmuls are naturally parallelizable: split the output dimension across threads, compute partial dot products, reduce. but launching threads has a fixed cost. if the per-matmul work is too small, the overhead dominates and parallelism makes things slower.
so the question becomes quantitative:
at what per-matmul FLOP count does thread parallelism become net-positive for single-token Q8_0 decode on a consumer CPU?
two experiments, same CPU (i5-1135G7, 4 physical / 8 logical cores), same Q8_0 kernel:
model-level: run three real models at 1, 2, 4, and 8 threads. measure decode throughput via Ember's per-operation tracer.
kernel-level: run a synthetic sweep of
matmul_q8_0_decode at six matrix sizes with a
fixed 1:3 aspect ratio (embed_dim: inter_dim ≈ 1:3). 100
measurements per cell, median and coefficient-of-variation
reported.
all code is in Ember.
| model | embed_dim | inter_dim | MFLOPs/matmul | 1 thr | 2 thr | 4 thr | 8 thr |
|---|---|---|---|---|---|---|---|
| Qwen3-0.6B | 1024 | 3072 | 6.3 | 6.97 tok/s | 6.48 (0.93×) | 5.89 (0.85×) | n/a |
| LLaMA-3.2-1B | 2048 | 5632 | 23.1 | 2.84 tok/s | 2.73 (0.96×) | 2.78 (0.98×) | n/a |
| LLaMA-3.2-3B | 3072 | 8192 | 50.3 | 1.05 tok/s | 1.53 (1.46×) | 1.64 (1.56×) | 1.55 (1.48×) |
each cell: median of 2–3 measured runs after 1–2 warmup runs. the engineering rule below rests primarily on the synthetic sweep (100 measurements per cell); treat these model-level numbers as directional confirmation, not high-confidence point estimates.
at 6.3 and 23.1 MFLOPs per matmul, threads are net-negative or
break-even. Ember's should_parallel_q8_decode gate
returns false at these sizes: the matmul stays single-threaded
while the larger thread-pool configuration provides no useful
parallel work and slightly regresses end-to-end throughput.
at 50.3 MFLOPs, 2 threads give 1.46×, 4 threads give 1.56×. 8 threads regress to 1.48× with high variance: the CPU has only four physical cores; hyperthreads contend for cache and memory bandwidth.
across all models, matmul_q8_0 stays at 99.4–99.6%
of runtime regardless of thread count. element-wise ops (RMS norm,
RoPE, SiLU) remain below 1% and never become the bottleneck.
to sample the transition region, a kernel-only sweep was run on
synthetic Q8_0 weights at six MFLOPs levels. the column
ms/op is median single-kernel latency: this is not
full-model throughput.
| MFLOPs | 1-thr ms/op | 2-thr ms/op | spdup | σ/median % | 4-thr ms/op | spdup | σ/median % | 8-thr ms/op | spdup | σ/median % |
|---|---|---|---|---|---|---|---|---|---|---|
| 14.2 | 1.68 | 2.00 | 0.84× | 9.1 | 1.62 | 1.04× | 6.1 | 1.69 | 1.00× | 6.0 |
| 25.2 | 2.97 | 1.91 | 1.55× | 11.3 | 1.19 | 2.50× | 14.1 | 1.15 | 2.59× | 13.7 |
| 31.9 | 3.84 | 2.19 | 1.75× | 10.9 | 1.65 | 2.33× | 12.8 | 1.54 | 2.50× | 15.1 |
| 39.3 | 4.67 | 3.76 | 1.24× | 18.7 | 1.94 | 2.40× | 6.6 | 1.86 | 2.51× | 13.3 |
| 47.6 | 6.88 | 3.40 | 2.02× | 12.5 | 2.32 | 2.96× | 12.0 | 2.21 | 3.11× | 9.9 |
| 61.4 | 7.23 | 4.68 | 1.54× | 8.2 | 3.30 | 2.19× | 10.7 | 2.93 | 2.46× | 10.1 |
speedup = ms/op(1 thread) / ms/op(n threads). each cell: 100
measurements. the synthetic harness bypasses Ember's per-call
should_parallel_q8_decode gate: it shows what the
parallel kernel would deliver if always activated, not
what a real model run currently does.
the 2-thread line crosses 1.0× between 14 and 25 MFLOPs. four and eight threads both outperform two threads across most sizes above 25 MFLOPs.
eight-thread results are less stable, with higher relative dispersion (stdev/median up to 15% vs 6–14% for 4-thread), so four physical cores provide the safer default on this CPU.
rayon thread-pool dispatch cost, measured with an empty
par_iter().for_each() loop:
| threads | median overhead |
|---|---|
| 1 | 35 ns |
| 2 | 4,127 ns |
| 4 | 5,891 ns |
| 8 | 10,250 ns |
at 14.2 MFLOPs, matmul latency is ~1.7 ms: scheduling overhead (~4 µs for 2 threads) is small in absolute terms. the real issue was the gate used at the time: it kept these small real-model calls serial.
the current Q8×Q8 implementation has since lowered that gate substantially; this paragraph describes the historical run.
on this CPU and isolated Q8_0 kernel, the first observed median speedup depends on thread count. two and eight threads cross between the 14.2 and 25.2 MFLOP samples; four threads are marginally positive at 14.2 MFLOPs.
this sweep does not by itself justify a universal threshold, and Ember's current Q8×Q8 gate is calibrated separately.
in the real-model experiment, performance peaked at four physical cores. in the isolated synthetic sweep, eight threads occasionally produced slightly higher median speedups, but with less stable results. the safe recommendation is to pin threads to physical cores.
this rule is specific to this CPU and this kernel. it should be re-tested on:
a fixed global thread count is the wrong abstraction.
different operations inside the same decode step have wildly different matrix sizes. the attention Q projection is 2× the K/V projection.
the MLP up/gate/down projections are 3× the attention output. the LM head is tens of times wider than the per-layer projections.
assigning the same thread count to all of them wastes cores on small matmuls and underutilizes them on large ones.
the next step is an adaptive scheduler:
if estimated_work < crossover:
    serial SIMD
else:
    physical-core parallel path
the crossover data collected here provides the calibration point. this is where the project stops being "i profiled my engine" and starts becoming runtime design.
the closest published system is ProfInfer (2026), which attaches eBPF probes to inference engines for fine-grained operator profiling. Ember's tracer provides the model-semantic counterpart: per-operation timing with exact layer, shape, and FLOP identity, plus output fingerprints for numerical parity checks.
llama.cpp's llama-bench gives end-to-end throughput
numbers but does not break down per-operation scaling. the
synthetic sweep here is complementary: it measures the kernel in
isolation to find the exact crossover.
all raw data and the tracer source are in the Ember repository.